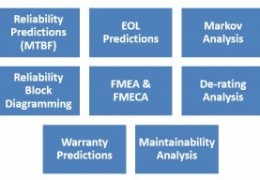
Reliability Predictions (MTBF)
Customers and markets are requiring product development teams to predict the product reliability in terms of MTBF. The resulting MTBF has various applications such and comparing design strategies, trade-off analysis, system availability, spares analysis, purchasing decision, cost of ownership, There are a number of standards that are used based on different customer & market requirements. The MTBF numbers are key drivers in calculating system / product availability.
- Parts Count Method (Assembly or System Level) – it estimates the reliability of the product utilizing any industry standards such as Telcordia SR-332 for commercial products and MIL-HDBK-217F generally applied to defense products.
- Part Stress Method (Assembly or System Level) – this method provides more accurate results since it uses the operating stress such as electrical, temperature or quality factor of components vs. parts count that uses default electrical stress levels.
Once the part stress product reliability prediction is performed, end of life prediction is performed. We have two levels of end of life predictions basic and advanced.
- Basic Level - this analysis calculates the product end of life by focusing on elements such as FANs, SSD, HDD, and electrolytic capacitors.
- Advanced Level – at this level we perform detailed analysis of your silicon technology based the latest advancement in the industry.
Both of these activities help companies to determine the cost of their service level agreements (SLA), warranty, re-call reserves, cost of ownership and overall contract negotiations.
Depending on product types and market requirements, there are various levels of availability that each must product must achieve. The product availability can be expressed in terms of % availability, downtime or DPM. There are a number of inputs that goes into this calculation such as MTBF that is calculated through reliability prediction and mean time to repair (MTTR) that is calculated through the system fault management evaluation and maintainability analysis. Availability analysis is performed at different stages of product development. It is used in the early concept / design phase to provide the recommendations on product architecture such as redundancy, switchover strategies that can have different level of impact on the product design and schedule. In the later phases it is performed to ensure the overall system design meets the intended customer requirements. Spares depot infrastructure plays a role in this calculation as well.
This is an easy and straightforward method to communicate reliability shortcomings to the design team. It uses blocks to model various elements of the system and can be used for analysis such as reliability allocation and architectural enhancements. For the detection time & probability Markov analysis is used, but to determine the required redundancy block diagramming is sufficient. It shows the relationship between blocks from ingress to the egress of the system. The key inputs are the system Bill of Material (BOM) or system functional block diagram. The block MTBF can come from BOM of each block, vendors, pervious generations, competitive analysis or past field data.
Customers have two options for the FMEA/FMECA. We can either provide facilitations or perform the actual FMEA/FMECA. The risk level and scoring mechanism will be developed in collaboration with the customers in order to ensure customer views and challenges are expressed in the parameters used in the FMEA/FMECA. Using different tools or just Excel spreadsheets can perform this analysis.
We work with our customer to develop a de-rating guideline to be used for the stress de-rating analysis or we apply customer current re-rating guidelines to perform this activity. The goal is to identify the components are overstressed and are at or above the de-rating levels. This technique allows the designers to build in reliability in their design through margin management. This is the single most effective way to improve short or long-term reliability of the product based on its market and customer requirements. One method that can be used for a quick testing of the design margins is HALT, which is designed to identify issues with design margins.
The goal of this analysis is to help the organization to determine the most impacting event in the warranty and how to mitigate the situations which at the same time improves manufacturing and warranty cost. It includes options based on development method, manufacturing and cost of warranty. We will provide recommendations on how to reduce warranty cost from early product design phase.


